
Following a meeting of the London Assembly’s transport committee in July, committee chair Caroline Pidgeon wrote to one of the meeting’s guests, Transport for London’s surface transport chief Gareth Powell, asking for the numbers of different kinds of road users who use Thames crossings TfL manages.
That isn’t all of them, of course. Primary responsibility for some of the most famous bridges – Southwark, Blackfriars, London and Tower – lies with their owner, the charity Bridge House Estates, and Waterloo Bridge is owned by Westminster Council. However, Powell has replied to Pidgeon with annual average daily flow figures during 2020 for those bridges (and tunnels) TfL owns and is fully responsible for: Vauxhall, Battersea, Lambeth and Westminster in the centre of London, and Chiswick, Kew and Twickenham bridges in west Outer London.
The first thing that strikes you is how busy Vauxhall Bridge was last year compared with the other two that link north and south Central London and Battersea further west. It was crossed by a daily average of 37,904 motor vehicles of all kinds, compared with Lambeth’s 19,290 and Westminster’s 12,680 and Battersea’s 25,322. Perhaps it’s no surprise that earlier this year TfL warned that the volume and type pf traffic that can use Vauxhall Bridge might soon have to be restricted if money for repairs is not found.
The Vauxhall daily average included 10,644 light goods vehicles, which was by far the highest of the four, though Westminster Bridge was used by more buses – 2,129 a day compared with Vauxhall’s 1,671. Vauxhall was also used by far more pedal cyclists than the other trio, with 9,172 per day, more than double the next highest for bicycles, which was Battersea’s 4,160.
The other interesting comparison is between those four bridges and the three suburban ones. Twickenham and Chiswick bridges had almost as many motor vehicles crossing them daily in 2020 as Vauxhall – 35,424 and 33,366 respectively – and significantly more than Westminster, Lambeth and Battersea, and more light goods vehicles than all three except Battersea, while Kew had more than twice as many light goods vehicles as Westminster.
Cycling levels on all three were much lower than all four of the Central London bridges: 1,384 a day on Chiswick, 1,340 on Kew and a remarkably tiny 89 a day on Twickenham Bridge – even the Rotherhithe Tunnel was used by an average of 161 pedal cycles a day. See the figures in full here.
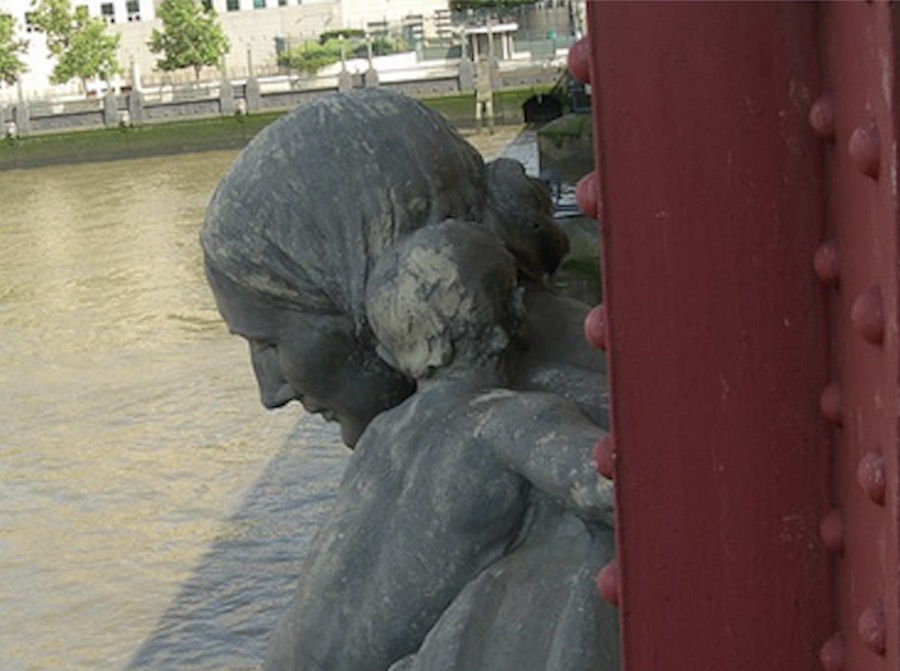
Photo: Famous detail from Vauxhall Bridge, captured by Victor Keegan.