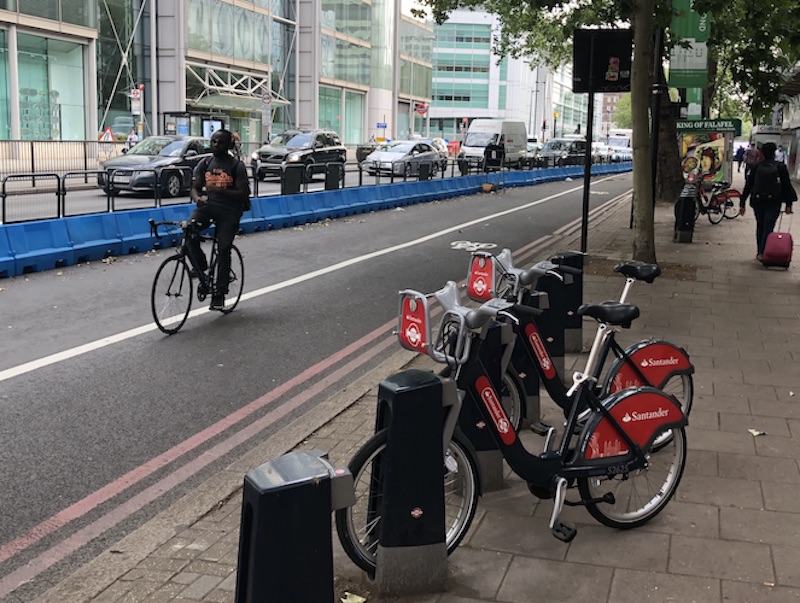
Great hopes have been expressed for a big increase in cycling in London as a silver lining to the dark cloud of Covid-19. From early in the first lockdown period, Transport for London and an array of the capital’s boroughs moved quickly to introduce new temporary cycling lanes (though some don’t look very temporary) as part of a wider programme called Streetspace, which is designed to foster “active travel”, including getting around by bicycle.
This policy was encouraged by national government – TfL’s two emergency funding settlements have included requirements that many millions of pounds are spent on fostering “active travel” on London’s roads, in part to forestall a “car-led recovery” while people remain wary of public transport. Boris Johnson’s transport adviser, his former media supporter Andrew Gilligan who is a cycling fanatic, has proclaimed on Twitter that national expenditure on cycling and walking shows that “sometimes good things can come out of bad ones”.
So what do TfL’s recent figures on bicycle use in the capital tell us as autumn deepens towards winter?
The picture is interestingly mixed. As readers of On London‘s Thursday email to qualifying supporters already know, TfL has helpfully supplied me with weekly figures from early September until the seven days commencing 4 November (monitoring weeks run from Wednesdays to Tuesdays), complete with comparisons with the equivalent weeks of last year.
The figures are for the number of times bicycles have passed the roughly 25 TfL “reporting sites” used to monitor cycle flows. The number of sites producing data has varied between 23 and 28 over the full period in question (sometimes there are technical problems with the process). The majority are in Central London areas.
There’s been a big difference between the weekday figures and those for weekends, which TfL helpfully separated from each other. Let’s look at the weekday ones first.
At first, as autumn got underway, more cycling journeys were recorded than during the equivalent week last year.
-
For the seven days commencing on 9 September, there was an average “daily site flow” of 2,995 bicycles past 28 reporting sites, an increase of 14% compared with the equivalent week of 2019.
-
For the seven days commencing 16 September, there was an average daily flow of 3,208 bicycles past the monitoring sites compared with 2,618 in the equivalent week of 2019 – a percentage increase of 23%.
-
For the seven days commencing 23 September there was an absolute rise of 255 per day, representing an 11% increase year-on-year.
However, since those three consecutive weeks, the amount of cycling measured at the reporting sites has actually fallen in all but one week.
-
Recording week beginning 30 September, a fall from 2,640 per day in 2019 to 2,238 per day – down 15%.
-
Recording week beginning 7 October, a fall from 2,462 per day in 2019 to 2,418 per day – down 2%.
-
Recording week beginning 14 October, a rise from 2,358 per day in 2019 to 2,539 per day – up 8%.
-
Recording week beginning 21 October, a fall from 2,118 in 2019 to 2,015 per day – down 5%.
-
Recording week beginning 28 October, a fall from 2,339 per day in 2019 to 2,084 per day – down 11%.
-
Recording week beginning 4 November, a fall from 2,301 per day in 2019 to 2,134 per day – down 7%.
By striking contrast, weekends have seen almost unbroken increases in cycle flows since early-September, most of them very large in percentage terms.
-
Weekend 19/20 September, a rise from 1,242 per day in 2019 to 2,446 per day – up 97%.
-
Weekend 26/27 September, a rise from 951 per day to 1,734 per day – up 82%.
-
Weekend 3/4 October, a fall from 1,077 per day to 820 per day – down 24%.
-
Weekend 10/11 October, a rise from 835 per day to 1,892 per day – up 127%.
-
Weekend October 17/18, a rise from 1,003 per day to 1,908 per day – up 90%.
-
Weekend October 24/25, a rise from 769 per day to 1,414 per day – up 84%.
-
Weekend 31 Oct/1 Nov, a rise from 750 per day to 1,305 per day – up 74%.
-
Weekend 7/8 November, a rise from 776 per day to 2,246 per day – up 189%.
What conclusions can be drawn from these figures? It’s obviously tempting to deduce from the big difference between those for weekends (almost all up a lot year-on-year) and those for weekdays (mostly down mostly recently) that there’s been a growing enthusiasm for leisure cycling but rather less than that for commuting or other work-related travel by bicycle.
That said, those weekday figures probably need to be viewed in the context of fewer people travelling to places of work in general, by whatever means. And, as TfL points out, cycling levels can be strongly affected by the weather. Firmer conclusions will have to wait until more months have passed, the effects of the pandemic begin to wane and more figures have been collected. Many thanks to TfL for their help with those so far.
originally posted at onlondon.com https://www.onlondon.co.uk/transport-for-london-figures-present-mixed-picture-of-autumn-cycling-levels/
Dave Hill: Transport for London figures present mixed picture of autumn cycling levels

